New study examines how interplay of factors affects COVID-19 vaccine rates

A new study that analyzes the interplay or of race, poverty, politics and age distribution on COVID-19 vaccination rates in each county across the United States has found that the impact of each factor is not universal across geographies.
Carsten Lange, professor of economics and an expert in data science, was a coauthor of the project which used machine learning algorithms and Artificial Intelligence Explanations (AIX) to quantify each factor contributing to the level of vaccination hesitancy.
“What’s particularly interesting is how the effect of one variable is not universal across geographies,” said Carsten Lange. “For example, the impact of political affiliation (measured as percentage of Republican votes in the last election) might be lower in a county with a large percentage of elderly population and higher when a county’s percentage of elderly residents is low.”
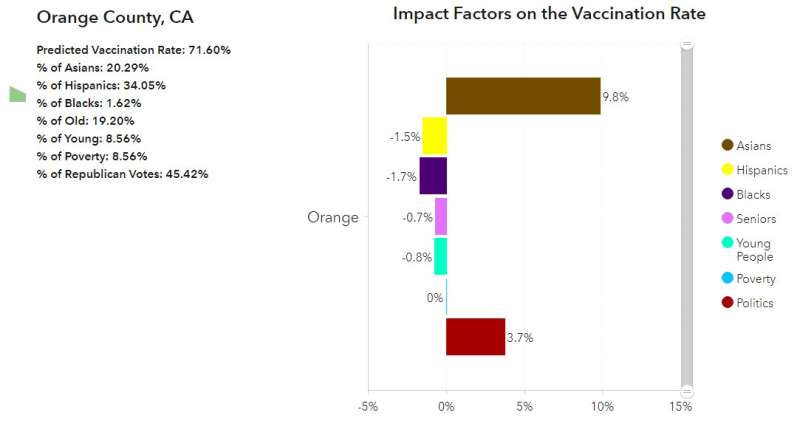
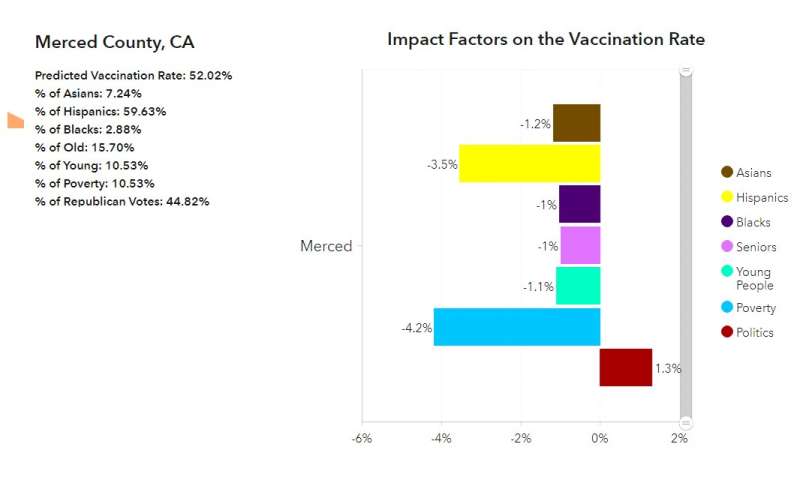
In California, voters in both Orange and Merced counties are 45 percent Republican. However, the impact of political affiliation on vaccination rates has a different impact when considering all variables simultaneously. The larger Asian population in Orange County (20 percent) drives the political impact on the vaccination rate higher. In Merced County, a lower Asian population (7 percent) reduces the impact of political affiliation.
While the model reveals that a county with a larger percentage of Asians, tends to have a higher vaccination rate, their impact can be modified by other differences within the community.

Marin County in Northern California has an Asian population of 5.8 percent, while nearby San Joaquin County’s Asian population is 15 percent. However, due to other disparities within the two Asian communities, the Asian population influence is higher on the vaccination rate in Marin County than in San Joaquin County, according to the study.
Variations between counties with a large percentage of African American residents are also more visible with a multivariant analysis. Both Prince George County (Maryland) and Kemper County (Mississippi) are about 62 percent African American. In Kemper County, the variable has a negative impact of 4.6 percent on the vaccination rate. In contrast, in Prince George County, the impact is 3.4 percent positive. Because Prince George County borders Washington, D.C., it’s possible that residents have a very different exposure and understanding of current affairs than the residents in Kemper County.
By highlighting the variable impact of different factors in each county, this research could be a helpful tool for local health officials and others working to improve vaccination rates in individual communities, said co-author Jian Lange, a principal product manager at Environmental Systems Research Institute (Esri) with a focus on spatial analysis.
“Traditional regression analysis is built on the assumption of constant impact factors over the entire study area, but in reality, variables have different impacts in different counties,” he said. “By implementing a state-of-the-art AI explainability algorithm, we are able to solve the black box problem with machine learning models and provide answers to the “how much” question for each measured impact factor in every county.”
Source: Read Full Article


